PID control stands for 'proportional, integral derivative' control which is the basis for many control strategies. A PID loop is calculated based on a setpoint, the feedback sensor reading and the difference between the two. Temperature control is the most common application of PID control in the HVAC world so we'll refer to temperatures and room setpoints in this discussion but PID loops can be used for any process like air air flow, building static pressure and water level to name a few.
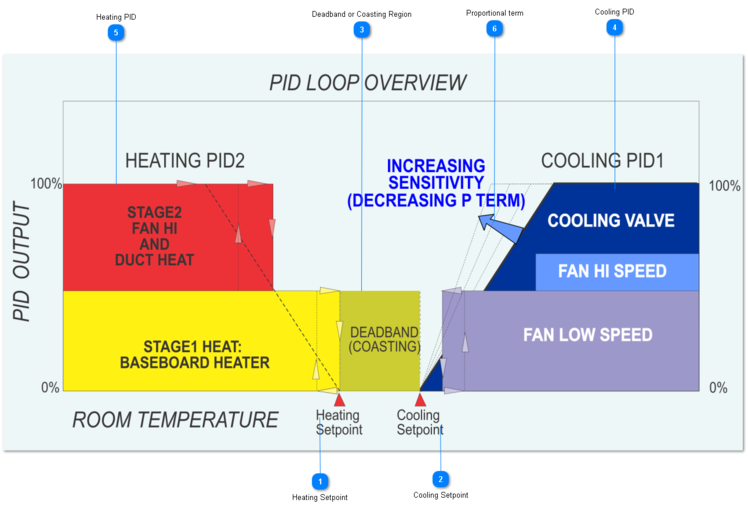
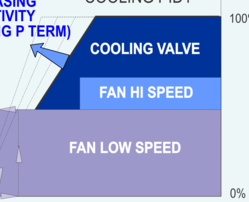
Below is a graphical view of a typical fan coil application in a room. The room temperature is along the X axis while the Y axis is the PID loop response from zero to 100%. The heating and cooling setpoints are shown along the bottom on the X axis. As the room temperature goes cold towards the left of the graph the heat comes on in two stages as shown by the red and yellow blocks. As the room heats up towards the right of the graph, the cooling PID ramps up and causes the fan to come on in the purple area and the cooling valve to modulate open as shown in the blue area.
Below are some explanations for the various sections of this graphic.
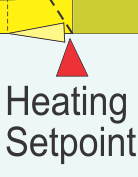
Heating Setpoint
The heating setpoint is shown here at pointer #1. In this example we have a separate heating and cooling setpoint since there is both heating and cooling in this application. The heating setpoint will be a variable which is normally adjusted warmer for the occupied period and cooler for the unoccupied period.
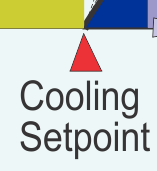
The cooling setpoint is shown here, it is also typically a variable in the T3 system which will be adjusted and managed by programs and schedules elsewhere in the T3 system according to the occupied and unoccupied period among other things. If the building takes advantage of load shedding the user program may nudge the setpoint warmer during periods of high demand.
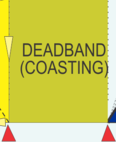
The region between the heating and the cooling setpoints is called the deadband region. Make this deadband large for more energy savings, or it can be a small area where you want to control the room temperature to a very narrow band. A small deadband region will use more energy than a wide deadband because the system must jump between heating and cooling every time there is a small disturbance so keep the deadband large for more energy savings and less cycling on the equipment.
The cooling PID is shown graphically as the blue region. As the room temperature goes along the X axis towards the right of the graph, the cooling PID output rises from 0 till it 100% after which it can get no larger, hence the flat section towards the far right of the graph.
The low speed fan comes on when the PID hits a certain trigger level of about 10% and high speed kicks in when the PID term hits approximately 80%. There is hysterisis between each stage which is simplified somewhat in this diagram, the low speed shows the dotted line for the low speed fan coming on and another for the fan going off.
The heating PID is shown graphically as the dotted line in the red heating region. As the room temperature goes colder & colder along the X axis towards the left side, the heating PID output will rise along the dotted line till it hits 100%. After hitting the max it continues as a horizontal line further towards the left of the graphic. No matter how much colder the room gets, the PID loop response can get no larger than 100%. As the room temperature falls below the heating setpoint the PID output rises which in turn causes the first stage of heating to come on. As the room gets colder the PID output hits 50% and stage2 heat comes on.
The programming for the staging is done in the control basic programs and the PID loop is set up in the PID work screens described in the next section.
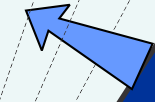
The blue arrow on the graphic shows how the PID term looks for different values of the 'P' setting which refers to the 'proportional' term in the PID terminology. When the temperature gets above setpoint the PID output will rise which starts the fan and opens the cooling valve to get the room temperature back to the setpoint.
A small P term translates into a STEEP line here which means the system will be more responsive, turning on the fan and opening the valve at the slightest bump in temperature over the sepoint. A large P term decreases the slope of this line which means the room temperature will have to be hotter, further to the right on this graph, in order to get a 100% response from the PID loop.
Small P term = hyperactive PID loop, think of a chipmunk opening the valve at the slightest disturbance.
Large P term = lazy PID loop. Think of a lazy bear, he'll eventually get around to opening the valve.
Adjusting the P term is done in the PID work screens below.